SmartView Monitor is a high-performance network and security analysis system that helps you easily administer your network, by establishing work habits based on learned system-resource patterns. It provides a central interface for monitoring network activity and performance of Check Point applications. It allows administrators to easily configure and monitor different aspects of network activities. Graphical views can easily be viewed from an integrated and intuitive GUI.
Predefined views include the most frequently used traffic, counter, tunnel, gateway, and remote-user information. For example, Check Point system counters collect information on the status and activities of heck Point Blades (for example, Firewall). Using custom or predefined views, administrator can drill down on the status that may be affecting network performance. If suspicious activity is detected, administrators can immediately apply a security rule to the appropriate Security Gateway to block that activity. These security rules can be created dynamically via the graphical interface, and can be set to expire within a certain time period.
Real-time and historical reports of monitored events can be generated to provide a comprehensive view of gateways, tunnels, remote users, network, security, and Security Gateway performance over time.


The default view is All Gateways, click on the specified Gateway name (in this case HQ-SG1), you can click either System Information, Network Activity or Licenses link.


Predefined views include the most frequently used traffic, counter, tunnel, gateway, and remote-user information. For example, Check Point system counters collect information on the status and activities of heck Point Blades (for example, Firewall). Using custom or predefined views, administrator can drill down on the status that may be affecting network performance. If suspicious activity is detected, administrators can immediately apply a security rule to the appropriate Security Gateway to block that activity. These security rules can be created dynamically via the graphical interface, and can be set to expire within a certain time period.
Real-time and historical reports of monitored events can be generated to provide a comprehensive view of gateways, tunnels, remote users, network, security, and Security Gateway performance over time.
To open SmartView Monitor, click on SmartConsole drop-down menu and choose
SmartView Monitor. Make sure that Monitoring is enabled (ticked) on the Check
Point Network Object (Secure Management Server and Security Gateway) under
General Properties > Network Security.


The default view is All Gateways, click on the specified Gateway name (in this case HQ-SG1), you can click either System Information, Network Activity or Licenses link.


There’s a lot of info that can be viewed under each folder tree. An example is Top Services and Top Destinations under Traffic folder > choose
traffic flow or direction and selectBranch-SG2.

You can select either Bar View (default view), Line view,
Pie view, Freeze (pause icon) the real-time graph and save the custom view.


You can view the health of a device under System Counters
> System.

Each time you click certain view, it
creates a tab at the top. To open all views at the same time, click on Tile
Horizontally, Tile Vertically or Cascade icon.


To always open a certain view whenever SmartView Monitor is
launched, right-click on the certain view and choose Run at Startup.

You can also set alert thresholds by going to Gateway Status
> Firewalls > right-click on the Security Gateway > choose Configure
Thresholds. You can either choose to do an Edit Global Settings or Custom.


Also make sure that the Start System Alert Daemon is enabled
under Launch Menu > Tools.

I tried to re-install the policy package to generate some
alerts.Just click on Alert (exclamation mark inside chat bubble icon) to view
new alerts in SmartView Monitor.


To manually block suspicious activity or an attacker without
creating a new rule, you go to Launch Menu > Tools > Suspicious Activity
Rules.


For dynamic blocking, you can go to Top Services (or any
view) > click on the specific service and do a right-click > choose Block
Service. You can specify either by Source IP, Destination IP and Expiration
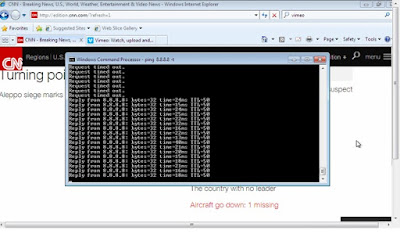
time. I’ve blocked ICMP to Google DNS IP 8.8.8.8 from Any Source IP for
10 minutes. Click Enforce in order to take effect.


The ICMP echo request and echo reply traffic slowly
diminished (0 Kbps).


To release the blocking, click on Suspicious Activity Rules (firewall icon) > select
either Show on All Check Point Security Gateways or Show On: for a specific
Security Gateway > click on the rule and choose Remove.

After the Suspicious Activity Rule has been removed, ICMP on
Branch PC was able to ping Google DNS IP 8.8.8.8 and SmartView Monitor Top
Service graph showed an increase in ICMP echo request and echo reply.
