SmartView Tracker is used for managing and tracking logs and alerts. It provides real-time historical and visual tracking, monitoring, and accounting information for all logged connections. Additionally, it logs administrator actions, such as changes to object definitions or rules, which can dramatically reduce the time needed to troubleshoot configuration errors. Security administrators can filter or perform searches on log records, to quickly locate and track events of interest. In the case of an attack or otherwise suspicious network activity, aecurity administrators can use SmartView Tracker to temporarily or permanently terminate connections from specific IP addresses.
1. Network and Endpoint tab - Network and Endpoint mode is the default view for SmartView Tracker. Network and Endpoint mode displays entries for security-related events for different Check Point products as well as Check Point's OPSEC partners.
2. Active tab - In the Active mode you can view connections that are currently open through the Security Gateways that are logging in the active Log file.
3. Management tab - In the Management mode you can show audit entries in the SmartView Tracker. The Management All Records Query is displayed.


I generated some HTTP and ICMP traffic from 10.1.1.50 to bring up new logs.


1. Network and Endpoint tab - Network and Endpoint mode is the default view for SmartView Tracker. Network and Endpoint mode displays entries for security-related events for different Check Point products as well as Check Point's OPSEC partners.
2. Active tab - In the Active mode you can view connections that are currently open through the Security Gateways that are logging in the active Log file.
3. Management tab - In the Management mode you can show audit entries in the SmartView Tracker. The Management All Records Query is displayed.
There are two ways to launch SmartView Tracker:
On Windows Task Manager click Start > All Programs >
under SmartConsole.


Under SmartDashboard > SmartView Tracker.

To go to the latest log click on Go to Bottom (down arrow icon). In this case, log 14395 is the latest entry. To auto retrieve or refresh logs
click on the Automatically refresh your view with new logs (down arrow inside a
square icon). I tried to made a ping to Google DNS IP 8.8.8.8 from SmartConsole
PC 10.1.1.50.


To search and display a certain type of Service, right-click
on Service > Edit Filter > under Specific type the service > click Add
and click OK.


To get the actual number of HTTP logs, click on the Get Number of
Filtered Records (the calculator icon). In this case there were 2519 HTTP logs
that were found out of the 14462 total logs.


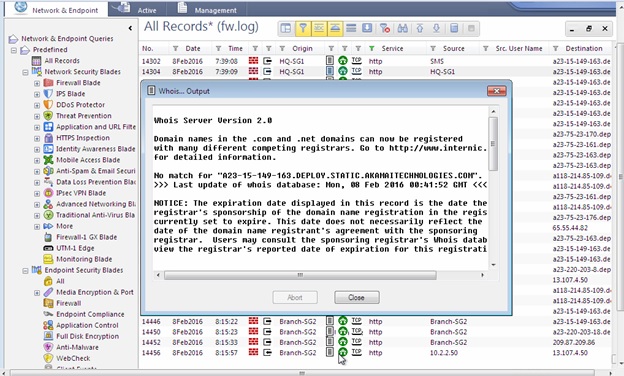
You can perform basic troubleshooting on the selected log by doing a right-click > Actions and choose the action such Ping, Whois, Nslookup (and if
allowed on the Firewall rule).


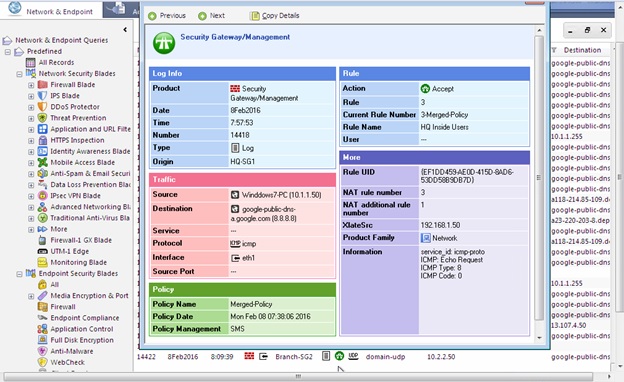
To view the rule for the selected log, highlight and
right-click on the rule and select View rule in SmartDashboard. In this case
policy rule #5 is allowing the said traffic.


To follow logs for a certain source or destination IP or
network object, click on the rule > Follow and choose either the Follow the
Source, Destination, Rule or Policy package. In this case I chose to Follow
Source: Windows7-PC.


To save this query to be used in the future, click on Save
Query As icon (beside Help icon), give it a name and it will be saved under the
Custom tree (bottom).


To view the rule that’s dropping the packet, just highlight
the drop log, do a right-click and choose View rule in SmartDashboard. In this
case log # 14462, Telnet (TCP port 23) is dropped by policy rule #2, which is
the Stealth Rule. Only SSH and HTTPS are allowed to the Security Gateway from
the specified source on policy rule #1.


To start a brand new fw.log file go to Launch Menu >
Switch Active File and optionally name the new log file by unchecking Default.


I generated some HTTP and ICMP traffic from 10.1.1.50 to bring up new logs.

To open the original log file go to Launch Menu > File
> Open and choose the fw.log file.

Under Active tab, you'll see all the current active connections
in real-time. When opened, it will prompt that this would have a performance
impact (if there’s quite a number of Security Gateways) and should be used with
caution on production network.


You can also perform blocking from Active Tab by highlighting
the log number > go to Launch Menu > Tools > Block Intruder. This is a very useful tool in blocking an
attacker in real-time without creating a policy rule which could take some time.
Best practice is to use Suspicious Activity Rules in SmartView Monitor.

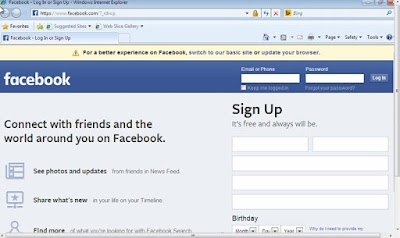
For this case we block Facebook access from 10.1.1.50 for 5
minutes.


To force release the blocking rather than wait
for 5 minutes, go to Launch Menu > Tools > Clear Blocking.


The last tab on SmartView Tracker is Management.

You can filter the log search by doing a right-click on
Operation column (or any column of interest) > Edit Filter > select the
field (or multiple fields by holding Ctrl) > click Add and click OK.

In this case, I want to see the Log In, Log Out and Install
Policy logs.


You can also save and go back to the customized query by
clicking on Save Query As icon and it will show under Custom folder. To go back
just click on All Records under Predefined or click on the funnel with a cross
mark icon.


You could also view the Rule Logs from SmartDashboard under
Policy > right-click on the rule > View Rule Logs.

It will open and redirect to SmartView Tracker using a
customized rule log window: Follow Rule 3.


To customized Log and Alert, click on Edit Global Properties
icon.


You can further customized logging under Network Object >
double-click on the Security Management Server (SMS). You can specify the size
in bytes of the fw.log and specify an external syslog server IP address.


By default the Security Gateway is sending logs to the
Security Management Server.


You could also simulate and practice using SmartDashboard
in Demo mode.


No comments:
Post a Comment